 Lina Lopes
 A Navigation Tool
After mapping out what we mean when we say BioArt — and recognizing that meanings shift depending on who is speaking, and from where — we began wondering: how is BioArt actually spoken about globally?
Over the past year, we collected and indexed every mention of “bioart” that appeared in our Google Alerts. We built a collaborative dataset using a shared Google Spreadsheet, cleaned it, and began observing patterns. Who is talking about BioArt? In what context? And in what language?
But collecting isn’t enough. How do we navigate this complexity?
We’ve now created a digital cartography of this one-year dataset using Svelte, D3, Mapbox, and GitHub Pages — hosted here. It’s a map, yes. But more than that, it’s a way to visualize presence, frequency, and distribution of a term that is both technical and poetic, academic and speculative.
This is not a definitive visualization. It is a navigation tool — an interface for asking questions.
For instance:
-
Why does China have nearly 400 indexed posts, many of them produced by a single media entity, writing regularly about “state-of-the-art” BioArt exhibitions?
-
Why do the United States entries resonate more closely with the concept of BioArt that we, Lina & Padilha, feel aligned with?
-
And how might this mapping help us ask: when I say “I’m making a work of BioArt”, who hears that the way I mean it?
We’re interested in anchor points — visual and semantic — that help humans navigate complexity. This tool invites you to explore where “bioart” is being said, and eventually, how it is being understood.
Next steps?
We’re working on analyzing semantic clusters within the dataset, tagging and exploring in what context the term “bioart” appears. Is it scientific? Artistic? Commercial? Political? Speculative?
And we’re asking: how do we build better tools to feel our way through language that is alive?
Technical Appendix: Building the BioArt Navigator
This project was built as a modular and entirely client-side visualization stack. Here’s a breakdown of the technical choices and steps we followed:
1. Data Collection & Cleaning (previous post)
-
We configured a Google Alert to track all global mentions of “bioart”.
-
Every new entry was automatically pushed into a Google Spreadsheet, which served as our living dataset.
-
We manually cleaned and enriched the dataset: identifying countries, standardizing names, and filtering out irrelevant or repetitive sources.
2. Visualization Environment
-
We chose Svelte (with Vite) for its lightweight reactive structure and fast performance.
-
The project is hosted on GitHub Pages, using the
gh-pagesbranch for the built version.
3. Reading CSV from Google Sheets
- The spreadsheet was published to the web as CSV, and we used
d3.csv()to fetch and parse it directly into the Svelte app.
4. Mapping with Mapbox
-
We used Mapbox GL JS to render an interactive 3D globe.
-
Each country was plotted using a custom HTML element as a marker, styled dynamically based on how many times it appeared in the dataset.
5. Coordinate Resolution
-
Instead of using the Mapbox Geocoding API, we manually created a
countryCoordinates.jsonfile containing [longitude, latitude] for each country. -
This file was stored in the
public/folder and loaded usingd3.json().
6. Marker Design
-
Each marker is a custom-styled
<div>with:-
A circular shape
-
Background color indicating data presence
-
A number inside, representing how many entries referenced that country
-
7. Popups & Interactivity
-
Clicking on a marker opens a Mapbox popup with a summary and a “See data” button.
-
That button calls a
window.selectCountry(country)function, which filters the table below to only show entries from that country.
8. Responsive Table
-
Below the map, we render a Bootstrap-styled table with the filtered data.
-
The table updates reactively based on the selected country.
This prototype is intentionally minimalist and modular — it can be expanded with filters by date, semantic clustering, topic tags, or even integrating language analysis models to infer tone or context.
If you’d like to explore the code or adapt it for your own dataset, feel free to clone the repo or reach out to collaborate. Github repository
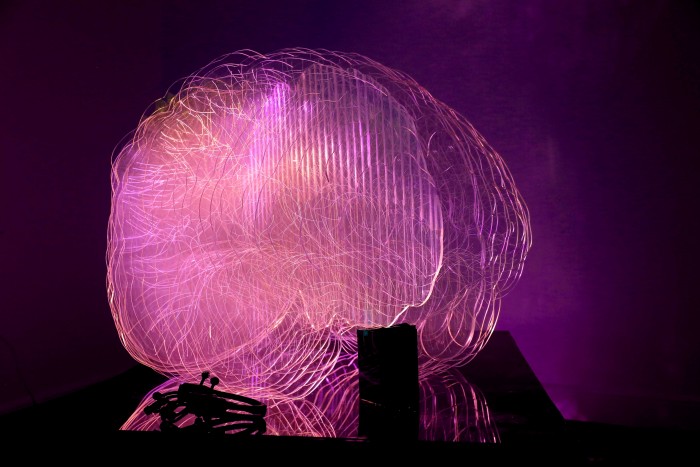 Artworks Where Brainwaves Speak in Light, Sound and Fabric